Loading...
Searching...
No Matches
debug_plot Namespace Reference
Functions | |
| list_txt_files (folder_path) | |
| parse_data_file (filename) | |
| compute_limits (all_x, all_y, default_x=(-10, 10), default_y=(-10, 10)) | |
| plot_parsed_data (ax, path_x, path_y, cone_x, cone_y, cone_colors, car_x, car_y, min_x, min_y) | |
| plot_data (filename, min_x=(-10, 10), min_y=(-10, 10)) | |
| main () | |
Function Documentation
◆ compute_limits()
| debug_plot.compute_limits | ( | all_x, | |
| all_y, | |||
default_x = (-10, 10), |
|||
default_y = (-10, 10) |
|||
| ) |
Compute axis limits given all data points and default limits.

Returns:
    tuple: (x_min, x_max, y_min, y_max)
Definition at line 40 of file debug_plot.py.
Here is the caller graph for this function:

◆ list_txt_files()
| debug_plot.list_txt_files | ( | folder_path | ) |
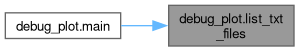
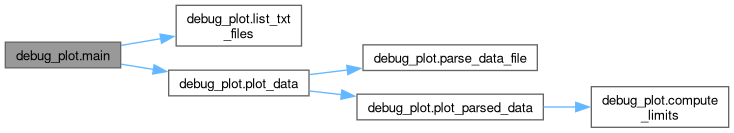
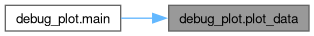
◆ main()
| debug_plot.main | ( | ) |
◆ parse_data_file()
| debug_plot.parse_data_file | ( | filename | ) |
Read the file and extract path, cone, and car data.

Returns:
    tuple: (path_x, path_y, cone_x, cone_y, cone_colors, car_x, car_y)
Definition at line 11 of file debug_plot.py.
Here is the caller graph for this function:

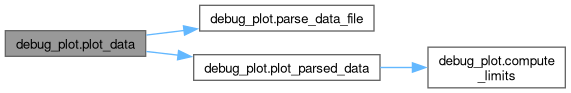
◆ plot_data()
| debug_plot.plot_data | ( | filename, | |
min_x = (-10, 10), |
|||
min_y = (-10, 10) |
|||
| ) |
Parse the file and plot the track, cones, and car position.

Parameters:
    filename (str): Path to the data file.
    min_x (tuple): Default x-axis limits.
    min_y (tuple): Default y-axis limits.
Definition at line 90 of file debug_plot.py.
Here is the call graph for this function:
Here is the caller graph for this function:
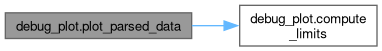
◆ plot_parsed_data()
| debug_plot.plot_parsed_data | ( | ax, | |
| path_x, | |||
| path_y, | |||
| cone_x, | |||
| cone_y, | |||
| cone_colors, | |||
| car_x, | |||
| car_y, | |||
| min_x, | |||
| min_y | |||
| ) |
Plot the parsed data on the provided axes.
Definition at line 59 of file debug_plot.py.
Here is the call graph for this function:
Here is the caller graph for this function:
